In this chapter, the simulation results are displayed and explained.
Contents
Figure 1 shows the result menu which can be called up via the |
|
button in the menu of the application. The menu is located on the left-hand side. From there, you can jump to the individual chapters. |
The content of this menu again depends on the connected model.
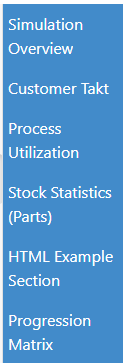
Figure 1 - Result menu
To select an alternative in the simulation results, the |
|
button must be used. |
By clicking on the Alternatives button in the application menu, a window appears on the right-hand side in which you can choose between the existing, simulated models.
In order to compare alternatives, they must first be added to the simulation results as described in point 1 of this chapter.
Then the existing tree structure of the simulation results can be expanded (see Figure 2) and the selected alternatives can be compared.
The presentation of the results depends on the order in which the models are listed in the upper part of the application (see Figure 4).
Figure 2 - Comparison of alternatives
Depending on the connected model, results can also be displayed in a HTML structure. In this example, the Plant Simulation HTML Report is viewable in the Frontend.
Gantt charts can be used to display the results as a progression matrix.
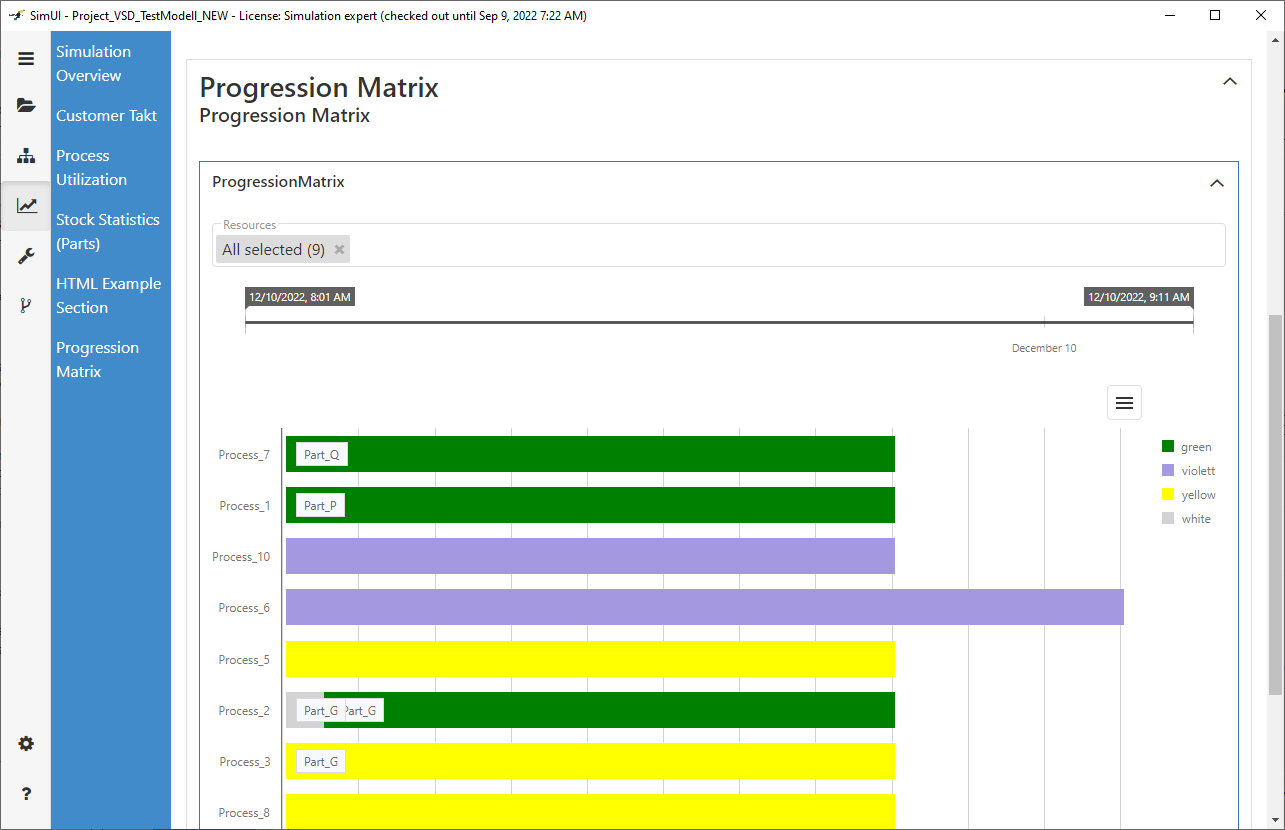
Figure 3 - Gantt chart
Using the dropdown Resources either all objects or a custom selection of objects can be used in the result view.
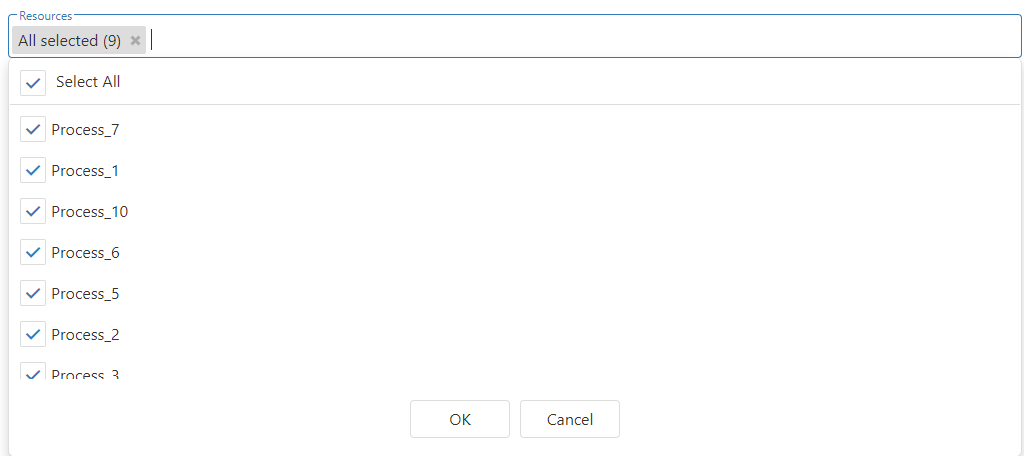
Figure 4 - Resources
Using the time line, time filters can be set in order to display only a certain period of time.
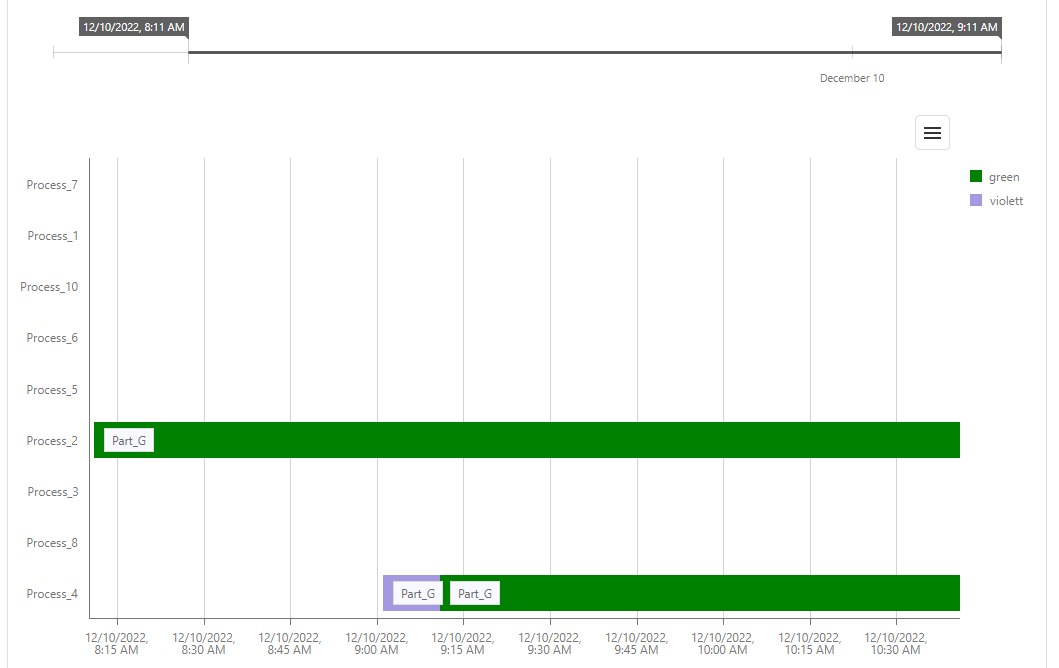
Figure 5 - Filter
© SimPlan AG - Hanau District Court, Commercial Register (Part B) 6845 - info@simplan.de - www.simplan.de