This chapter explains the local project settings.
Contents
1.6 Visualize deviations from main alternative
Figure 1 shows the local project settings. These are divided into the tabs General and Simulation.
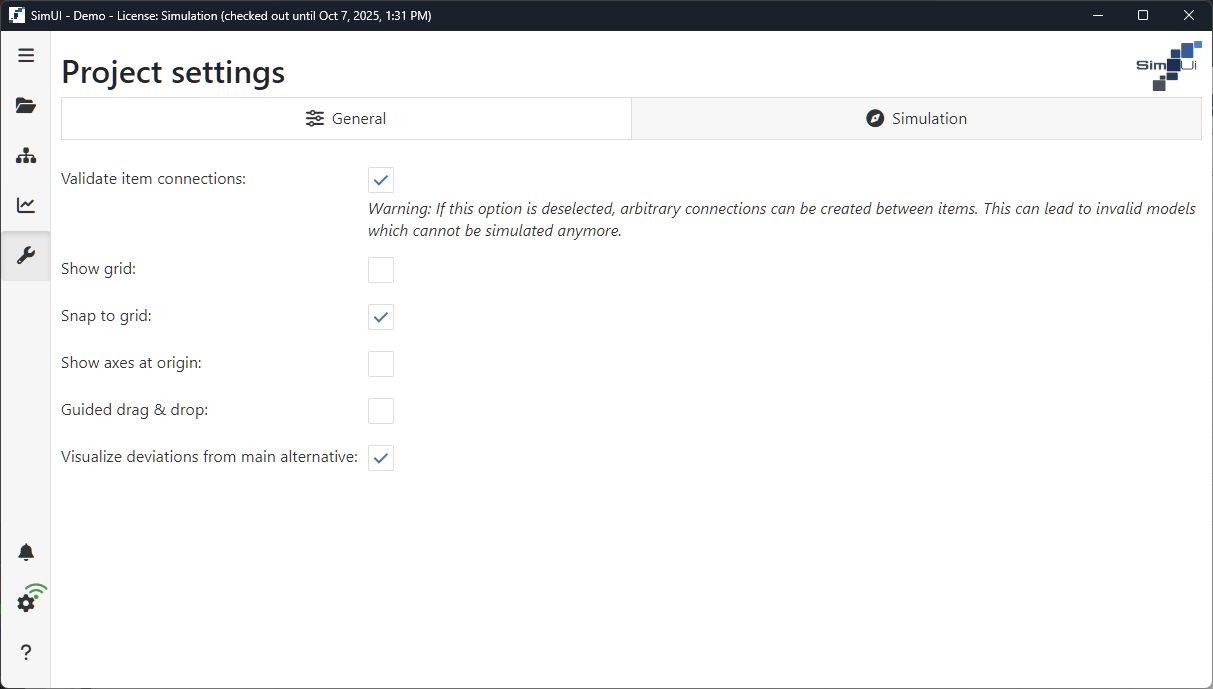
Figure 1 - Project settings
By checking the Validate item connection checkbox, those objects to which valid connections can be created are marked when a model is created.
If the checkbox is deactivated, all links can be used. Link validation is then completely inactive. This can lead to projects being generated that cannot be simulated.
The checkboxes Show grid and Snap to grid have an effect on the representation of the modeling (see Figure 2).
By activating this option, a grid is displayed in the modeling interface, which can simplify the arrangement of objects.
If the option is enabled, objects in the modeling interface are automatically aligned to the grid, which can simplify the arrangement of objects.
If the option is activated, an X and Y axis is displayed at the zero point in the modeling interface.

Figure 2 - Show axes
If the option is activated, guides will be displayed in the modeling area to help arrange the elements in parallel.
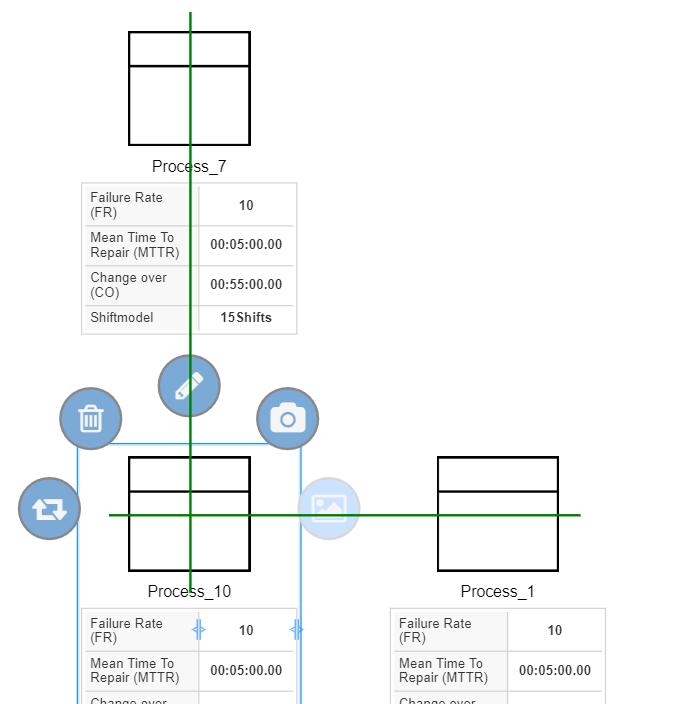
Figure 3 - Guided drag & drop
1.6 Visualize deviations from main alternative
In the other alternatives, each parameter value is compared with the corresponding parameter value from the reference alternative.
The link exists via the module name and types ("class"): Each parameter is compared with the parameters of the module with the same name and types in the reference model.
If no object with the same name/types exists in the reference model, the object in the current alternative is marked with a![]() in the current alternative
in the current alternative
If at least one parameter of an object has a different value than in the reference model and the check box Visualize deviations from main alternative is activated, an icon is displayed above the object to indicate the deviation (see Figure 4).
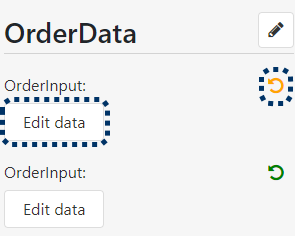
Using the edit menu/sidemenu, the user can view these deviations and either change them manually or reset them to the original values by clicking the![]() icon to reset them to the original values.
icon to reset them to the original values.
Figure 4 - Visualize parameter deviations |
Figure 5 - Revert data |
Figure 6 - Revert data dialog
Figure 7 - Info dialog |


The simulation periods can be defined in the Simulation section.
The calendar icon at the end of the Simulation start date and Simulation end date fields can be used to set the respective time periods, the arrows can be used to switch between single days.
By clicking the button Today todays date is automatically selected.
Once the time periods for the simulation have been defined, the simulation duration is automatically calculated and displayed in the Simulation Duration (Days) field.
In the field Simulation duration (days) a value can also be defined manually. After entering a value in this field, the date in the Simulation end date field is automatically adjusted.
In the field Statistics reset (days) you can define after how many days a reset of the statistics should be performed.
Using the parameter random numbers variant, results can be compared using the random stream (see Figure 8).
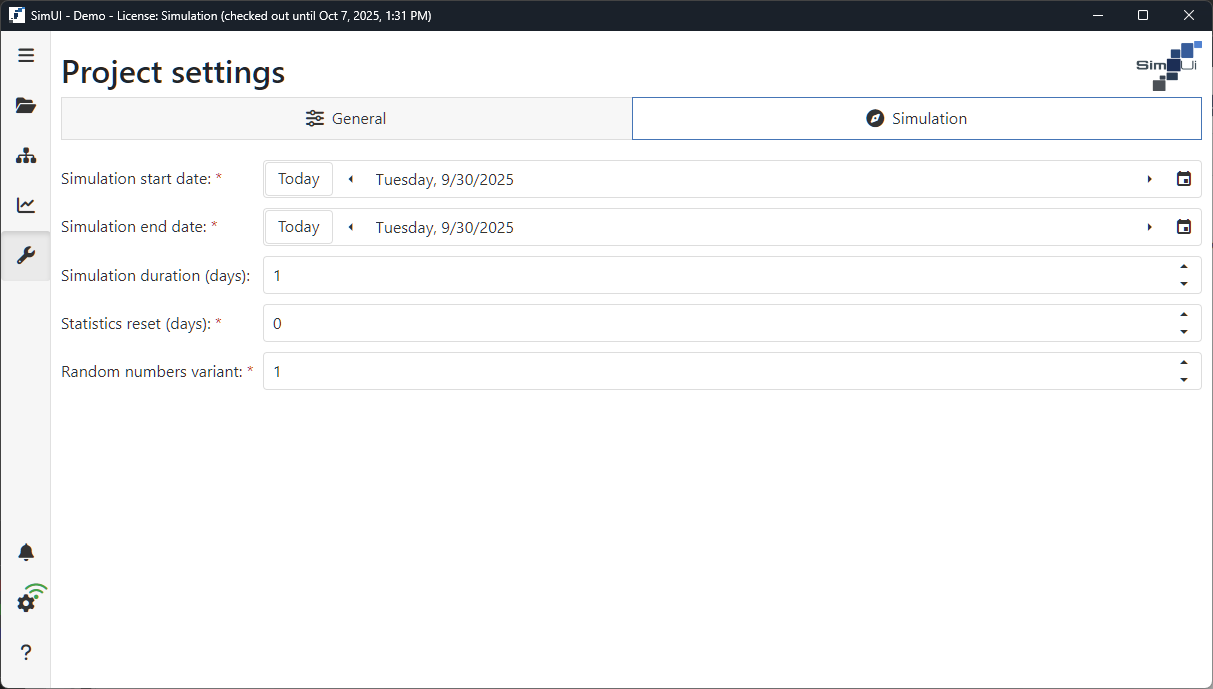
Figure 8 - Simulation settings
© SimPlan AG - Hanau District Court, Commercial Register (Part B) 6845 - info@simplan.de - www.simplan.de